
 The analytics platform
Steer your business from one place
The Biron analytics platform brings your dashboards and your KPIs together, team by team, in one single place. Every figure on screen rests on your data dictionary, so it is reliable, consistent from one team to the next, and traceable all the way back to its source.
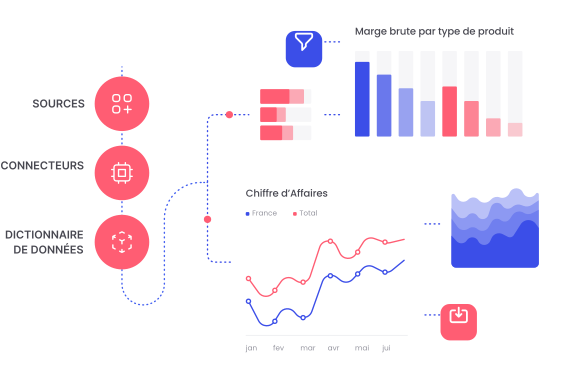
A dashboard tool shows figures. Ours shows the right ones.
Most analytics tools plug into your data as it is — duplicates, diverging definitions, gaps between one department and the next included.
The Biron platform starts from the opposite end. It only ever renders on top of the data dictionary: when you look at your margin or your revenue, you are seeing the definition your teams signed off, the same one for everybody.
You stop steering on figures that need checking, and start steering on a base of truth.
Every team follows its activity, its own way
From onboarding onwards, Biron sets up with you, for each team, a handful of starting dashboards built around your indicators and the way you steer. Each team therefore has, straight away, a clear, reliable and actionable reading of its own activity.
From the platform, anyone can:
- Follow their KPIs and how their performance is moving, at a glance.
- Reach the indicators they need in order to decide, without depending on another department.
- Find the same figure, understood the same way, whichever team they are in.
Teams
- Revenue, gross and net
- Gross margin by line
- Customer receivables
- Cash flow forecast
- Acquisition cost
- ROAS by channel
- Traffic & conversion
- LTV by cohort
- Weighted pipeline
- Average basket
- Performance by rep
- LTV by cohort
- Service level
- Stock rotation
- Delivery time
- Logistics cost per parcel
- Consolidated view
- Variance vs. budget
- Profitability by activity
- Headcount & productivity
Everyone builds the view they need
Become self-sufficient. Past the starting dashboards, nobody has to wait for a data team to prepare a view: each team explores and creates freely, from one shared base of truth.
-
Explore
Your teams query the data freely to dig into a figure, cross two indicators or answer on the spot a question no dashboard anticipated.
-
Build your dashboards
Pie charts, curves, histograms, headline figures: from your own views and metrics, compose whatever dashboards you want, over the periods that matter to you, with the comparisons you choose.
-
Break the silos
Every team draws on the same foundation and finally shares one overall view of the company’s performance. Data moves between departments instead of staying locked in a silo.
-
Manage the rights
You decide who reaches which figures. Rights are managed on your side, down to the individual indicator: each user sees only what concerns them.
An infrastructure built for speed and reliability
-
Reports in an instant
Under half a second to load a chart. You move through your data with no waiting.
-
A quality audit
every nightTests run nightly across the whole of your data to catch the slightest anomaly. You start the day with figures that have already been checked.
-
The stack, run for you
We manage the infrastructure and the data warehouse: updates, flows, scaling. Your teams concentrate on the analysis, not on the plumbing.
-
One foundation, every team
Every department works from the same base of truth. No more figures diverging from one service to the next.
-
Your rights, under your control
You decide who sees what: access governance stays in your hands.
-
Hosted in France & Europe
Your data is hosted in France and Europe, in line with the GDPR.
The power of a platform with the support of experts
Biron is not a generic tool handed over without follow-up. Our data experts configure the platform around your business, train your teams to use it, and adapt it as your needs change.
It is that capable technology plus the expertise that comes with it which separates Biron from a plain dashboard product.
Steer your business on figures you can trust
Talk to a Biron data expert and see what your own analytics platform could look like.
Talk to a data expert