Biron for Excel & Google Sheets

Your Biron analyses, straight in your spreadsheets

Install Biron in Excel or Google Sheets. Pull your metrics instantly into the tools you already work in, and refresh your tables in seconds, with no re-export at all.

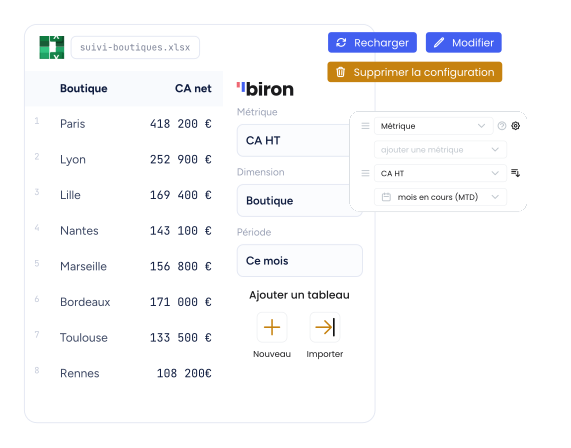
A workbook named "suivi-boutiques.xlsx" listing net revenue by store — Paris, Lyon, Lille, Nantes — with the Biron panel open beside it, set to the "Revenue excl. tax" metric, the "Store" dimension and the period "This month".

All of Biron’s power, in the tool you already know

Your teams love spreadsheets, and hate redoing exports and figures that never quite add up. The Biron add-in ends that back-and-forth: your analyses land directly in Excel and Google Sheets, ready to use, and update themselves without a re-export.

You keep your tool, your formatting and your formulas. What you gain is reliability.

The figures in your spreadsheet come from the same dictionary as your dashboards: same definitions, same results. No more versions drifting apart.

Start from what you need, or from a chart already built

Whether you want to compose an analysis of your own or reuse an existing chart, the Biron plug-in follows the way you work. No query to write, no technical skill required.

  • Compose your analysis yourself

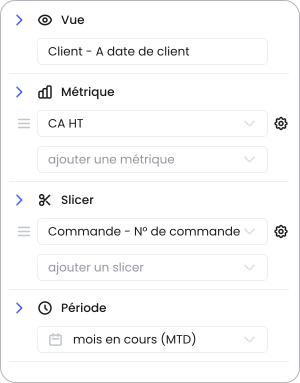
    The Biron panel carries the interface your teams already know: pick metrics, dimensions and period, and the table drops in wherever you want it. Several analyses can live on one sheet.

  • Reuse an existing chart

    Already happy with a dashboard? Copy the chart’s link from Biron, paste it into the spreadsheet, and its configuration comes across as it is. You start from work already done.

Your analyses under control at any moment

Step 1

Refresh on demand, or automatically

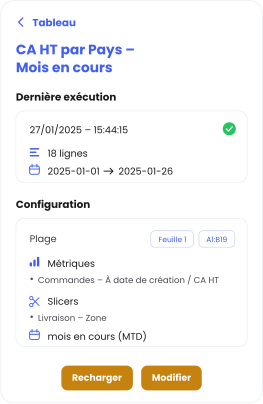
In Excel: reload one sheet or the whole workbook in a click, and watch the progress in real time.

In Google Sheets: schedule the update to suit you — by hour, by day, by week. Your files are ready without you thinking about it.
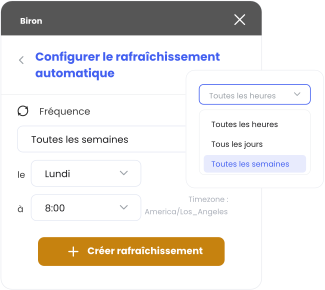
The "Configure automatic refresh" dialog: weekly frequency, Monday at 8:00, with the list of frequencies open beside it.

Use cases that earn their place in every team

  • Finance

    Monthly reporting without the chore

    Your revenue and margin analyses feed your model. One click before the committee, and you present certified figures rather than yesterday’s export.

  • Retail

    Multi-store tracking, automatic

    One workbook per region, refreshed every morning in Google Sheets. Your teams open their file and everything is already up to date.

  • Leadership

    A shared file everyone
    actually trusts

    No more "v_final_2": one Sheet where everybody reads the same Biron analyses, with no version sprawl and no doubt about which figure is right.

To be done with manual exports

See how Biron makes your data reliable and usable, right down to your spreadsheets.

Talk to a data expert